Unveiling the System's Secrets: The Magic of Observability
The goal of this article is to teach the concepts of Observability, Logs, Metrics, and Tracing, based on the literature and on hands-on experience in large companies.
We are going to learn how to apply them in a practical project and understand how they relate to each other.
- Table of Contents
“You can't manage what you can't measure.”
-- Peter Drucker
🔭 So, What Is Observability?
The term emerged in 1960 in the field of control engineering, introduced by the engineer Rudolf E. Kálmán, and was popularized by On The General Theory of Control Systems.
In Control Theory, Observability is a measure of how well the internal states of a system can be inferred from knowledge of its external outputs.
This means that observability proposes to understand how a system reached a state by looking at its outputs.
In this way, it allows us to deal with current problems and even to solve new ones.
But not everything is magic... To be able to identify the state of a system by looking at its outputs, the application must be properly instrumented, that is, it must emit signals that can be captured and analyzed.
We divide these signals into three pillars: traces, metrics, and logs. However, having the signals alone is not enough; it is necessary to collect, transmit, and store this data.
We call the collection, transmission, and storage of this data Telemetry.
 Generated by DALL-E
An application is properly instrumented when developers do not need to add more instruments to solve a problem, because they already have all the information they need — that is, without the need for a new deploy to add more instruments. Think of instruments as: new software, file or configuration changes, etc.
Of course, this maturity is reached over time, and it is a continuous process of improvement. It would be impossible to instrument everything at once, because there will always be problems that have not manifested themselves... yet.
The Three Pillars of Observability
| Pillar | Description |
|---|---|
| Metrics | Measures quantitatively, commonly used to compare and track performance along a timeline. |
| Logs | A record that an event occurred. |
| Tracing | Tracing is a mechanism for following the flow and progression of data through a piece of software. |
Conclusion
Well-instrumented applications are able to answer questions about their behavior by analyzing them from the outside, and that is what we call Observability.
Instrumenting applications is the act of emitting signals; these signals are divided into 3 pillars: traces, metrics, and logs.
Telemetry is the process of collecting, transmitting, and storing these signals.
1. 📜 Logs: Secrets Hidden in the Code
1.1. Introduction
Every piece of software runs methods/functions, and most of the time these executions have something to tell us that makes them worth recording. So...
Logs are records of events that occur in the software.
Below I list some types of logs:
- Application Logs
- Audit Logs
- Authorization and Access Logs
- Change Logs
- Event Logs
- Resource Logs
- Server Logs
- System Logs
- Threat Logs
- Transaction Logs
We are going to cover only application logs, which are logs generated by a running application.
Typically, in an application log record we find:
TimestampMessageLevelContext Data
1.2. Log Levels
DEBUG- Detailed information, normally of interest only to developers.INFO- Captures events that occurred but that are not errors.WARN- Indicates that something unexpected happened, but the software is still able to work.ERROR- Indicates that at least one system component failed and may interfere with part of or the overall operation.FATAL- Indicates that the system cannot continue to operate.
1.3. Log Formats
Below we will look at some of the log structures most commonly found in the market. JSON tends to be the most used one because it is easy to parse and because it is structured.
1.3.1. Structured
- JSON
- XML
- CSV
- Logfmt
- Syslog (RFC 5424)
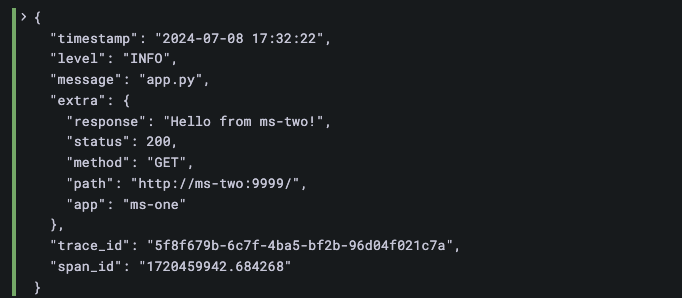
In the example above, note that there are two fields, trace_id and span_id; we will cover them further ahead.
<log>
  <timestamp>2024-07-10T14:45:23Z</timestamp>
  <level>INFO</level>
  <message>User logged in</message>
  <user>john.doe</user>
  <ip>127.0.0.1</ip>
</log>
timestamp,level,message,user,ip
2024-07-10T14:45:23Z,INFO,User logged in,john.doe,127.0.0.1
timestamp="2024-07-10T14:45:23Z" level=INFO message="User logged in" user="john.doe" ip="127.0.0.1"
<165>1 2003-10-11T22:14:15.003Z mymachine.example.com evntslog - ID47 [exampleSDID@32473 iut="3" eventSource="Application" eventID="1011"][examplePriority@32473 class="high"]
1.3.2. Semi-Structured
- Common Event Format (CEF)
- NCSA Common Log Format (CLF)
CEF:0|Security|ThreatDetection|1.0|100|User logged in|5|msg=User logged in src=127.0.0.1 user=john.doe
192.168.0.1 - jane [08/Jul/2024:10:23:45 +0000] "POST /login HTTP/1.1" 302 512
1.3.3. Unstructured
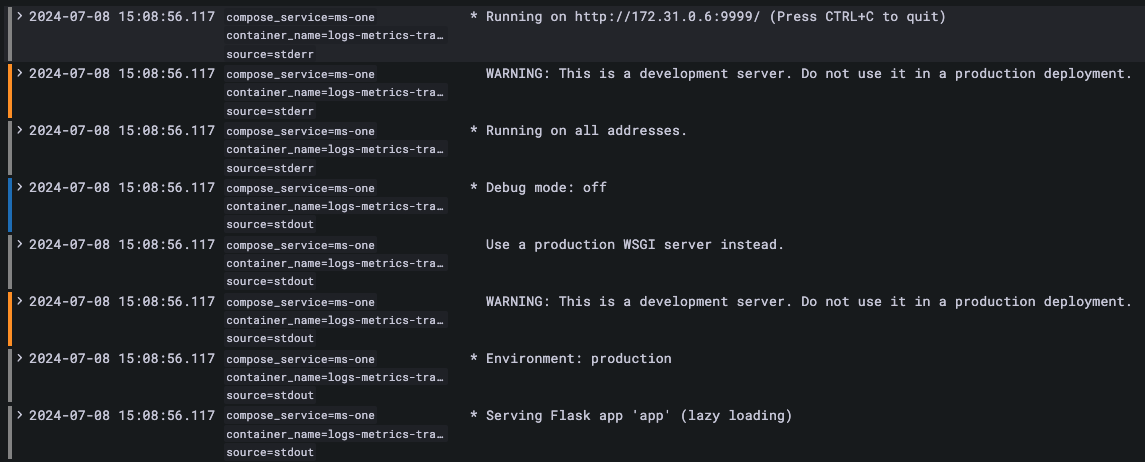
What is the difference between Semi-Structured, Structured, and Unstructured?
Semi-Structured logs have a fixed structure, but the fields are not fixed.
For example,
Logfmtalways has the samekey=valuestructure with a space separator, but the fields can vary.
Structured logs have a fixed structure and the fields are fixed.
For example,
JSONalways has the same fields (if implemented that way), meaning all logs have the same fields, such astimestamp,level,message, andextra, but the values can vary.
Unstructured logs do not have a fixed structure, meaning the fields and values can vary.
For example, plain-text logs.
1.4. Implementation
How do you use logs in an application? Below we see a code snippet from a Flask application in Python that I built to illustrate this article.
@app.route('/')
def hello():
  message = f"Hello from {MS_NAME}!"
  Logger().info('app.py', {"response": message, "status": "200", "method": "GET", "path": "/", "app": MS_NAME})

  return message
The code is emitting a structured log through the Logger abstraction to override the default behavior of Python's logging.
Now let's analyze the JSON output of the log generated by this code.
{
  "timestamp": "2024-07-05 19:59:37",
  "level": "INFO",
  "message": "app.py",
  "extra": {
    "response": "Hello from ms-one!",
    "status": "200",
    "method": "GET",
    "path": "/",
    "app": "ms-one"
  }
}
The destination of this output could be a file, a database, a log service, etc. In our case we are just printing the log to the console, stdout and stderr.
1.5. Architecture
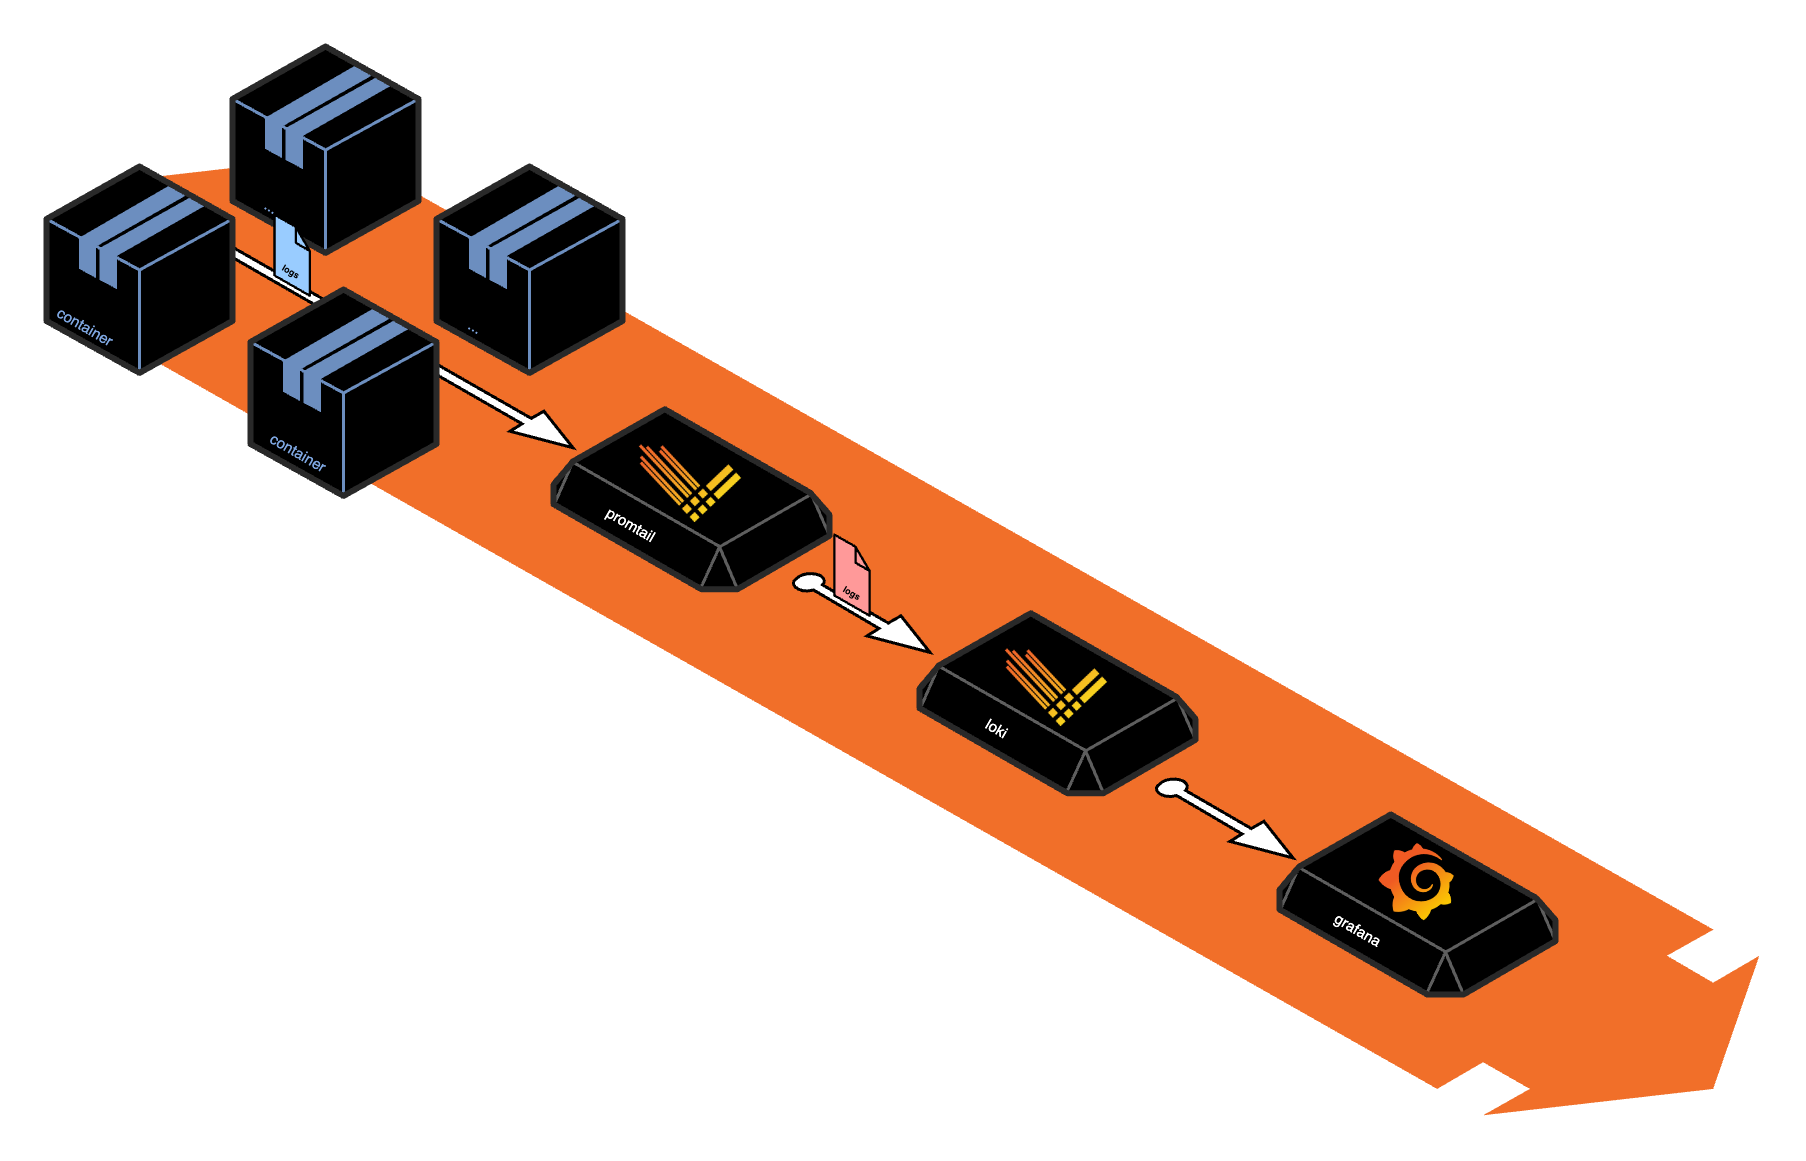
In the example above, promtail is an agent that collects logs from the containers and sends them to Loki, which is a log storage system, while Grafana is a log visualization tool that consumes directly from Loki.
Storing logs ends up becoming expensive 💰 over time, so it is important to define which events truly have value and to standardize the output structure.
Look for strategic points within the application code to emit logs with relevant context; this will help you track the software's behavior from the outside using some log visualization tool and will allow you to build dashboards with metrics from that data, making it easier to discover problems and supporting decision-making.
Conclusion
Structured logging allows you to run more complex queries more easily, and to build metrics from the logs.
With unstructured logs, parsing is harder because the structure is not fixed, and building metrics can become more complex. It can lead to broken dashboards and metrics depending on how the query was built.
This does not mean it is impossible to build metrics from Semi-Structured and Unstructured logs, but it ends up being difficult when there is no standard.
Define the logging best practices for your application and follow them:
- Define the log levels that should be emitted in production; do not emit
debug. - Define the output format (JSON, XML, CSV...).
- Define the fields that should be emitted.
- Define when to use an error log.
- Define when to use an info log.
- Define when to use a warning log.
- Define when to use a fatal log.
- Design the code to emit logs at strategic points.
- Define the destination of the logs (stdout, stderr, file, database, log service, etc.).
- Define the log retention policy (X days).
2. 📈 Metrics: Decoding Software Performance
Metrics are values captured in your systems at a specific point in time.
Examples:
- the number of users who logged into your system in the last 2h
- the number of requests your application received in the last 24h
- the average response time of a request within the last 1h
They can be collected once per second, once per minute, or at another regular interval to monitor a system over time. Their data is commonly stored in a time-series database, such as InfluxDB, Prometheus, Graphite, etc. In Prometheus, collection is done through scraping.
We also build metrics from application logs, filtering and aggregating the data within a time interval. We call this technique White-box monitoring.
For example, from the application logs that have the field extra_path="/health", we can count how many times the /health route was requested within a time interval. See below:
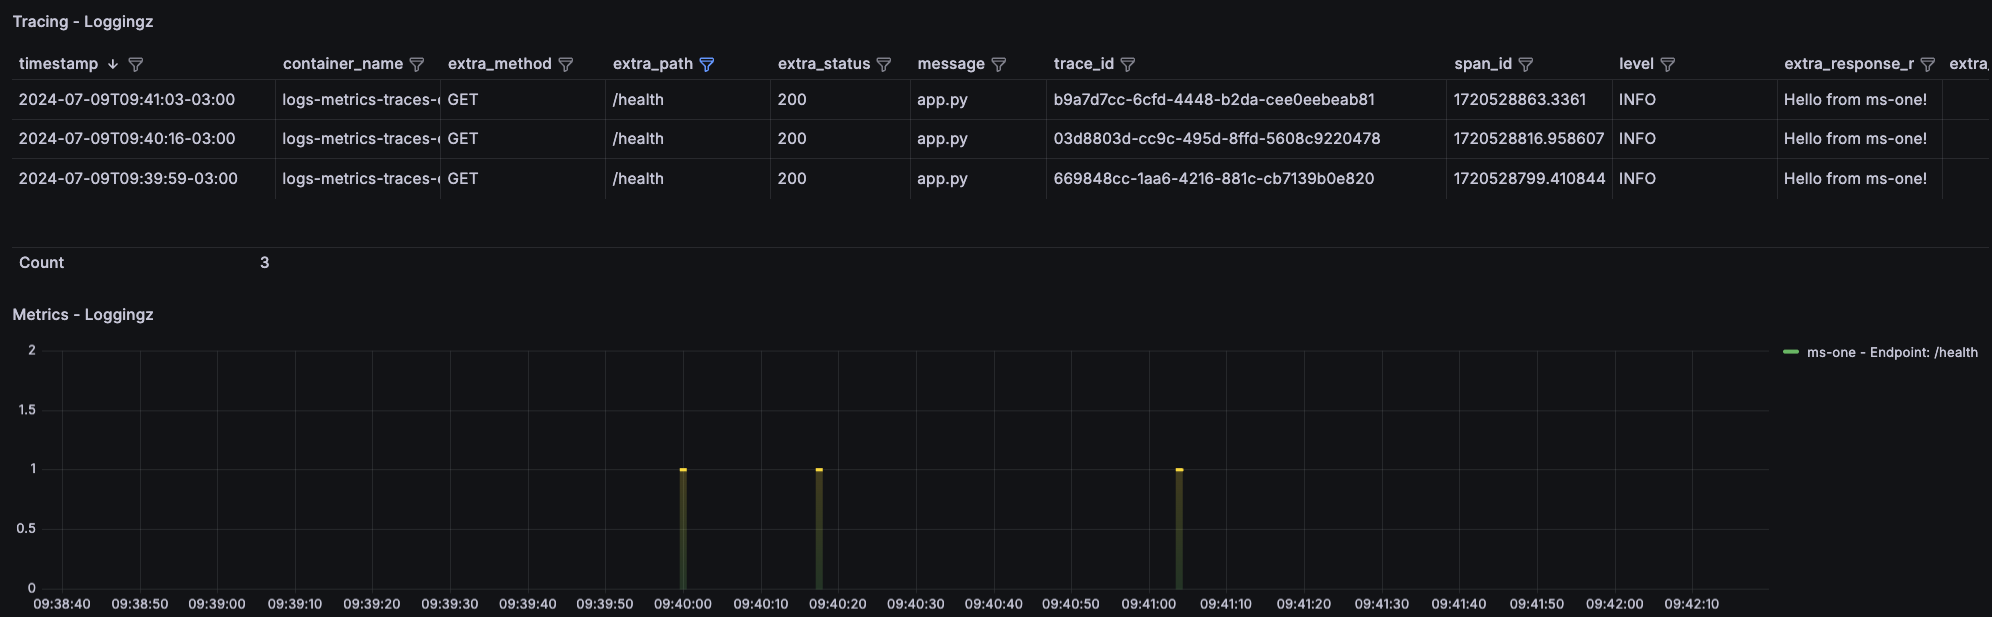
3 requests were made to the /health route within an interval of ~1 minute. In this case we built a Traffic metric.
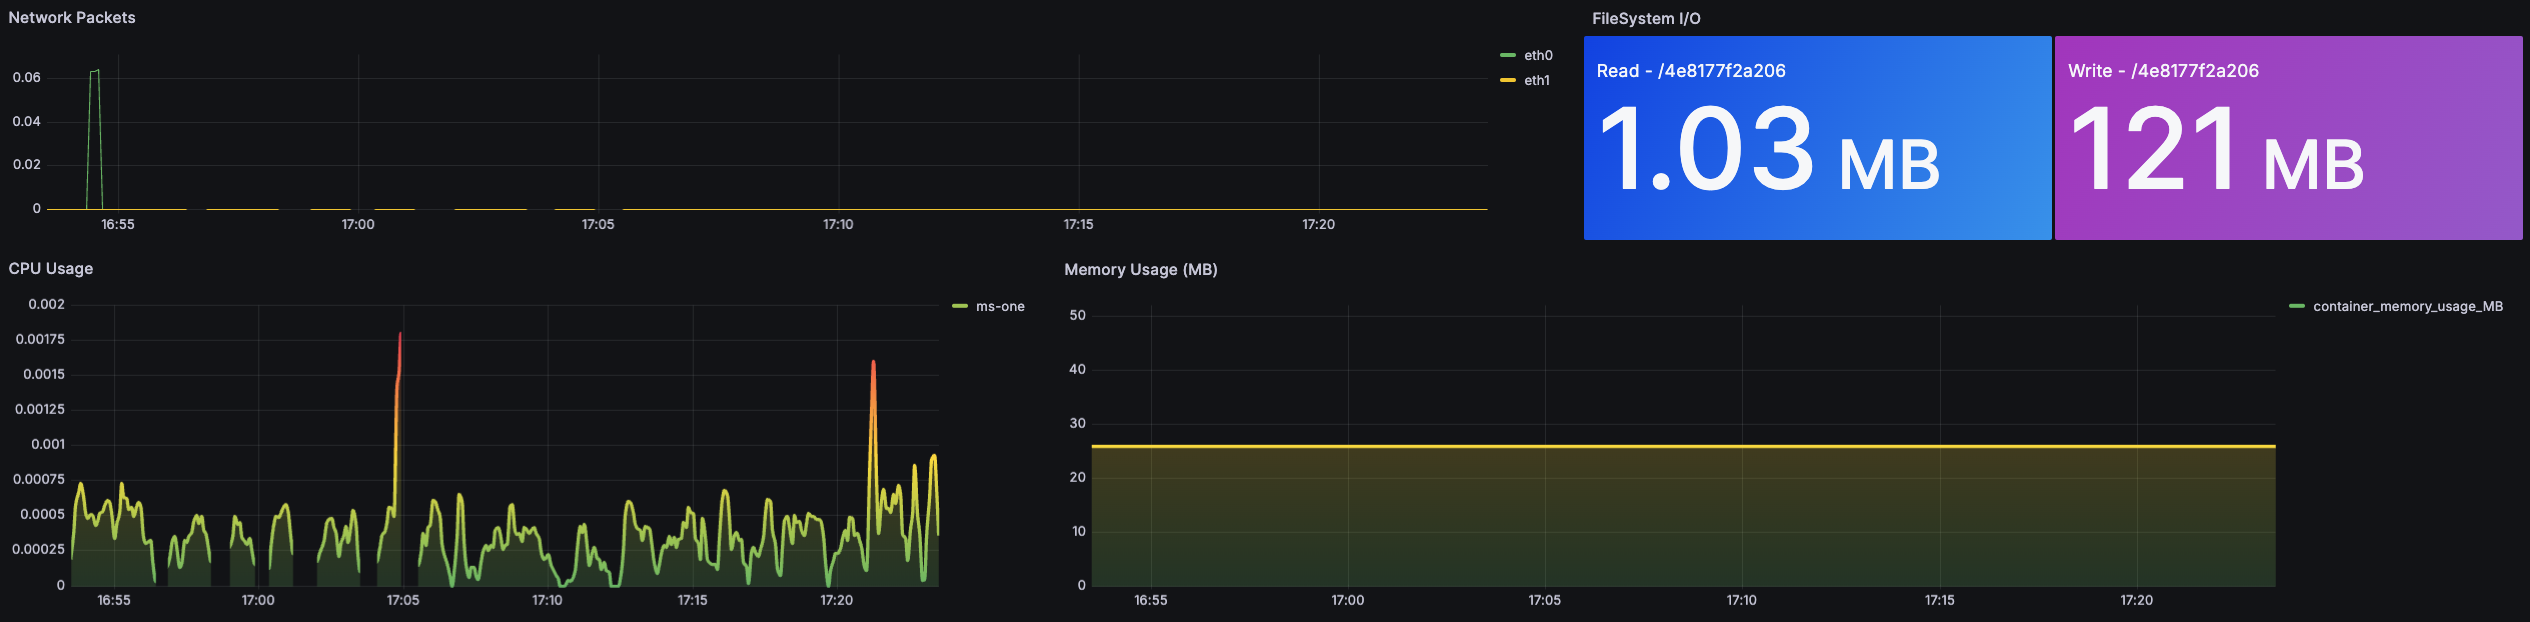
2.1. Resource Metrics (CPU, Memory, Disk, Network)
Resource metrics are metrics that measure a system's resource usage, such as CPU, memory, disk, and network. These metrics are essential for monitoring the health and performance of a system and for identifying bottlenecks and performance problems.
| Signal | Description |
|---|---|
| Utilization | Measures the amount of a resource that is being used. |
| Saturation | Measures the degree to which a resource is near its maximum capacity or beyond. |
| Errors | Measures the number of errors that occurred while using a resource. |
| Jitter | Measures the variation between when a network packet is transmitted and when received. |
| Capacity | Measures the maximum amount of work a system can perform. E.g.: 8GB RAM, 3vCPU |
2.2. Service Metrics (Four Golden Signals)
Introduced in Google's SRE book, these 4 metrics are meant to understand the system's usage experience from the users' point of view — Service-Oriented.
| Signal | Description |
|---|---|
| Latency | Measures the time the system takes to respond to a request. |
| Traffic | Measures the number of requests the system is receiving. |
| Errors | Measures the number of errors the system is returning. |
| Saturation | Measures the degree to which a resource is near its maximum capacity or beyond. |
The most common performance metric is latency, which represents the time needed to complete a unit of work. Latency can be expressed as an average or as a percentile, such as "99% of the requests returned in 0.1s".
The average is widely used to understand the overall performance of a system, but the average is not such a reliable value, because it can be distorted by extreme values; percentiles, on the other hand, are useful to understand performance across different quantiles of the distribution.
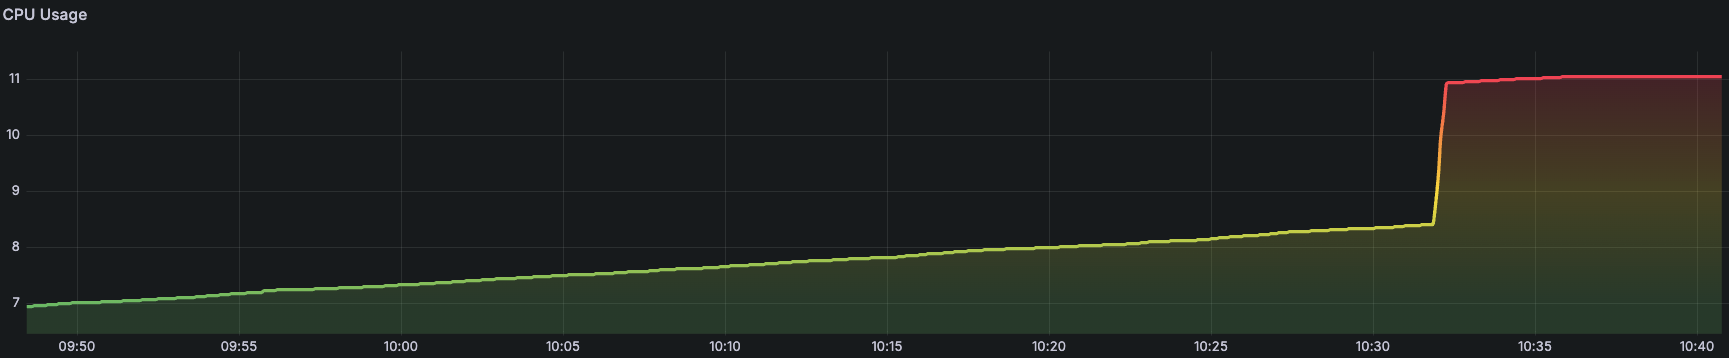
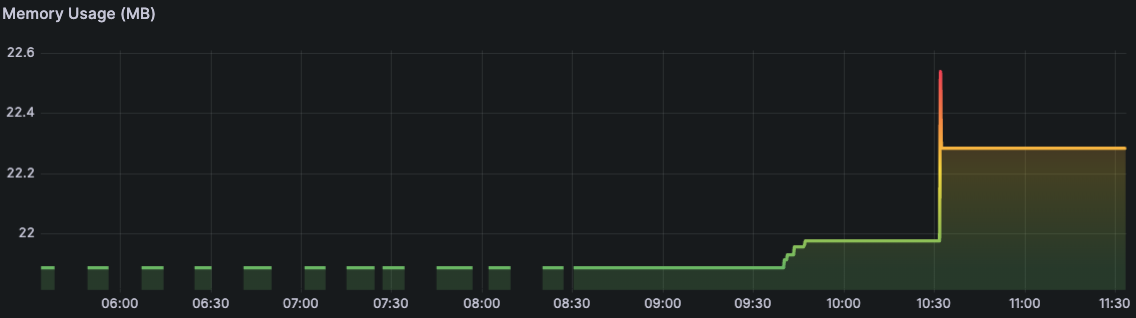
Below I show a dashboard to monitor the total CPU usage of a Container. I ran a simulation of 1000 requests and we can see the CPU spike.
2.3. Some Best Practices
-
Easy to Understand It should be possible to quickly determine what each metric or event represents.
-
Cost Storing metrics can be expensive, so you should collect only what is really necessary.
-
Granular If you collect metrics that are too aggregated, you may lose important information. For example, if you collect the average latency of a request, you may lose information about latency spikes that can be important to the user experience. If you collect metrics that are too granular, you may end up with too much data that is hard to analyze. Find a balance between granularity and aggregation that works for you.
-
Scope Label Each of your hosts operates simultaneously in several scopes, and you may want to check the health of any of these scopes, or their combinations. For example: how is metric X overall? And metric X in the U.S. Northeast?
-
Lifetime Keep a data retention policy that allows you to investigate past problems and identify trends over time.
2.4. Architecture
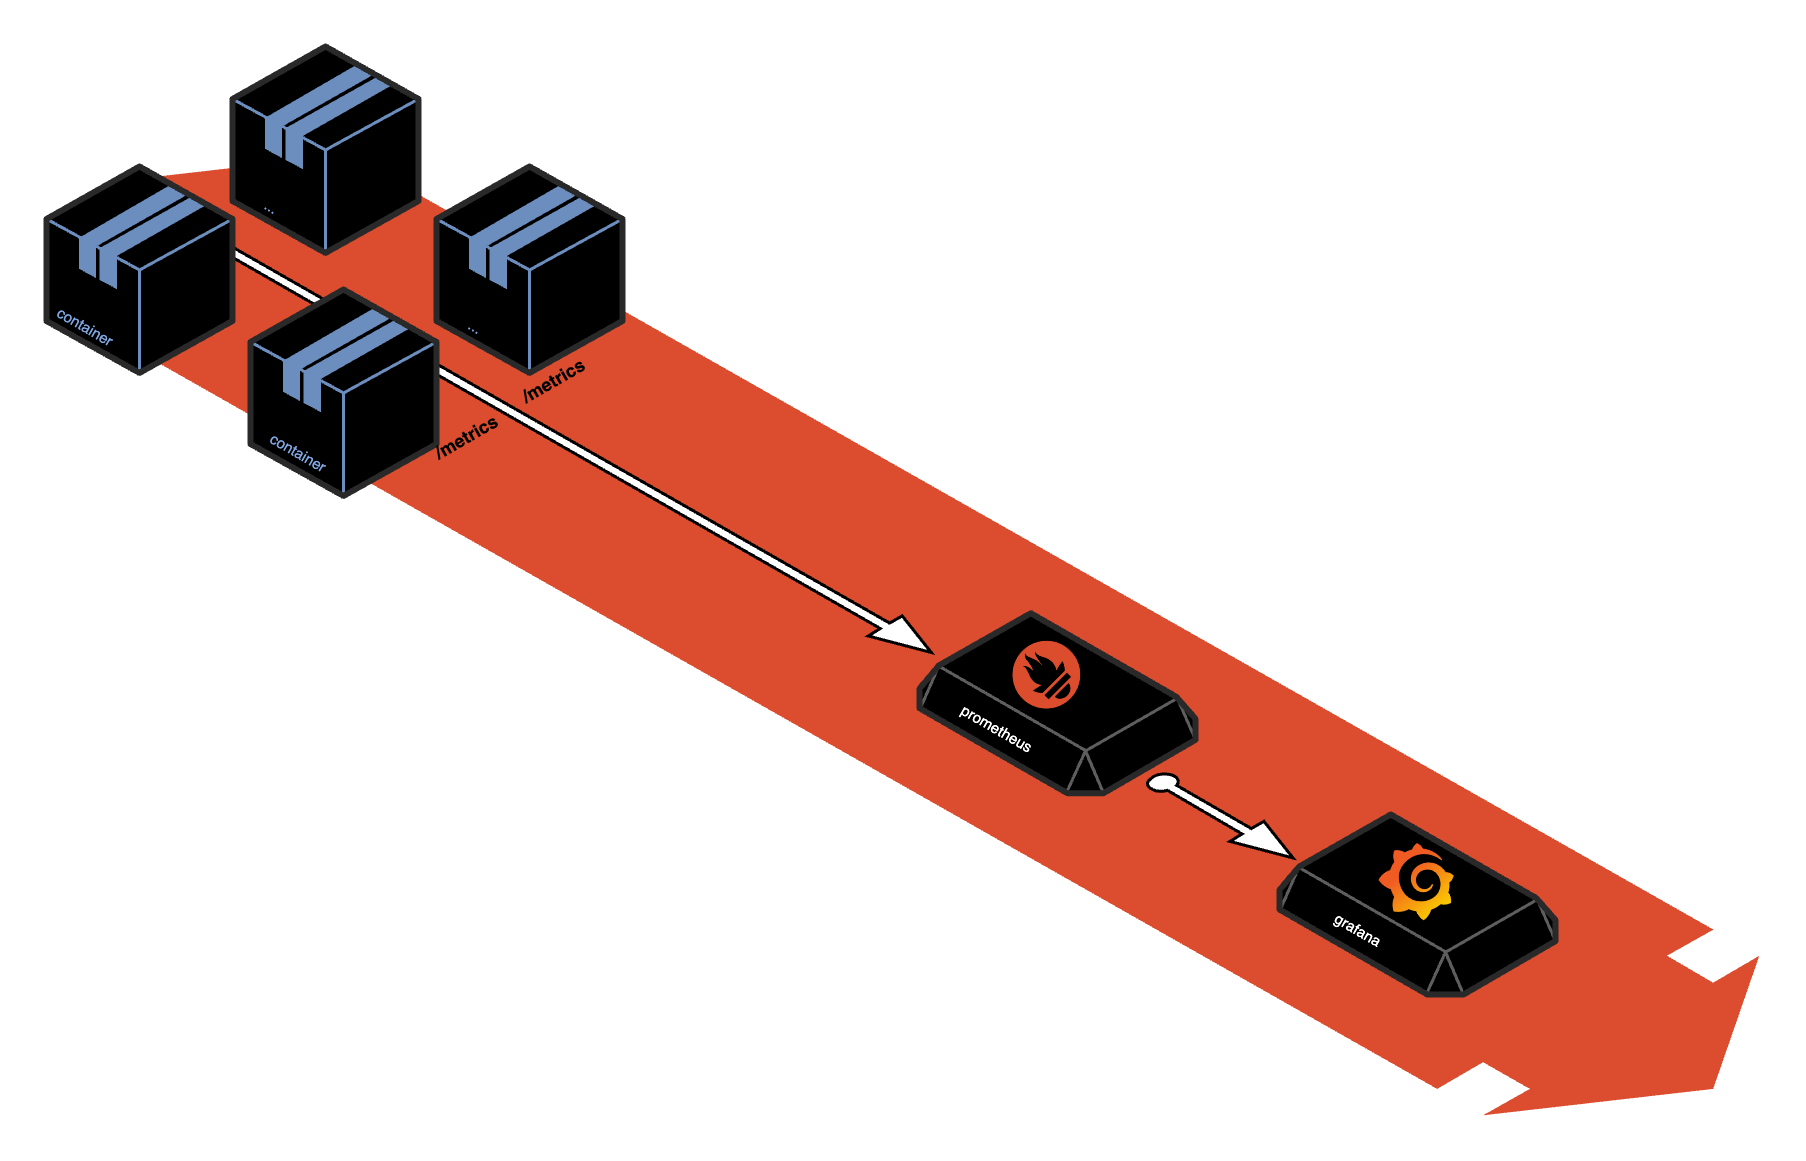
Conclusion
Metrics are able to inform the past and present state of the system, and help predict behaviors that may occur in the future.
They answer which part of the software is being accessed the most, which part is consuming the most resources, which part is slower...
They are not limited to just resource metrics, but also to business metrics, such as the number of sales, the number of active users...
But remember, metrics are just numbers, and to understand what those numbers mean, you need logs.
3. 👣 Tracing: Tracking Secrets
The main goal of tracing is to provide detailed visibility into how the processing of a given call was carried out, and how it relates to other calls.
When that request extends beyond the application, tracing becomes distributed, and we call it Distributed Tracing.
A CLI application, for example, can be instrumented to generate traces.
This is done by recording each important operation or event during the lifecycle of a request.
One of the main components of tracing is the concept of a span.
TRACE
  |-- SPAN
  |     |-- LOG
  |     |-- LOG
  |     |-- LOG
  |-- SPAN
  |     |-- LOG
  |     |-- LOG
Note that a span can contain several logs.
A span represents a unit of work or operation and contains information such as:
- Operation name
- Start and end of the operation (timestamps)
- Additional metadata or attributes (such as user IDs, operation types, etc.)
- Relationship with other spans (parent-child)
- Logs associated with the operation
Spans can be organized into a hierarchy that reflects the structure of the request's execution, making it easier to visualize how a request is processed end to end within an application.
Example
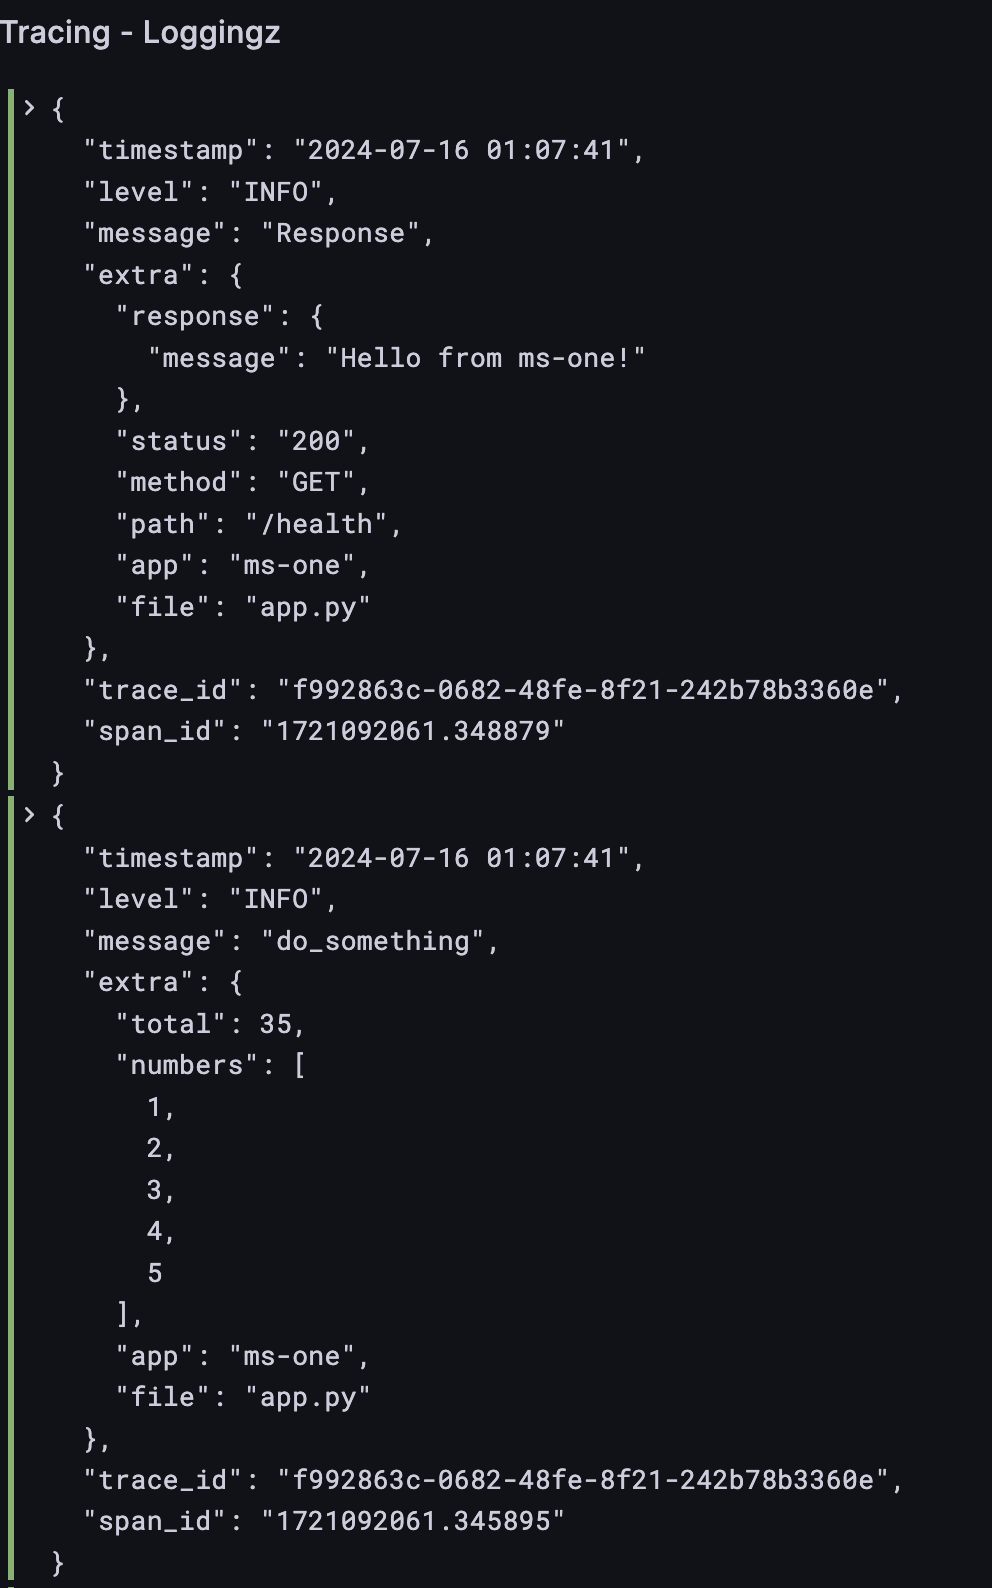
Below I show the output of a Python class I created that generates structured logs. In it, you can see two spans that were generated for the same trace_id.
However, it is basic, meaning it does not include the concept that a span has 1..N logs. We see that 1 span has 1 log.
Note that the trace_id is the same for both spans, which indicates that both spans are part of the same request.
This request is executing 2 different methods of the application, and both methods are generating logs.
3.1. Distributed Tracing
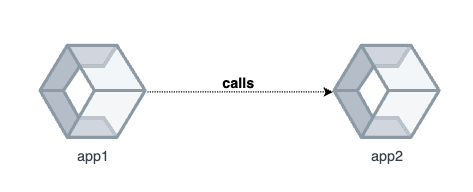
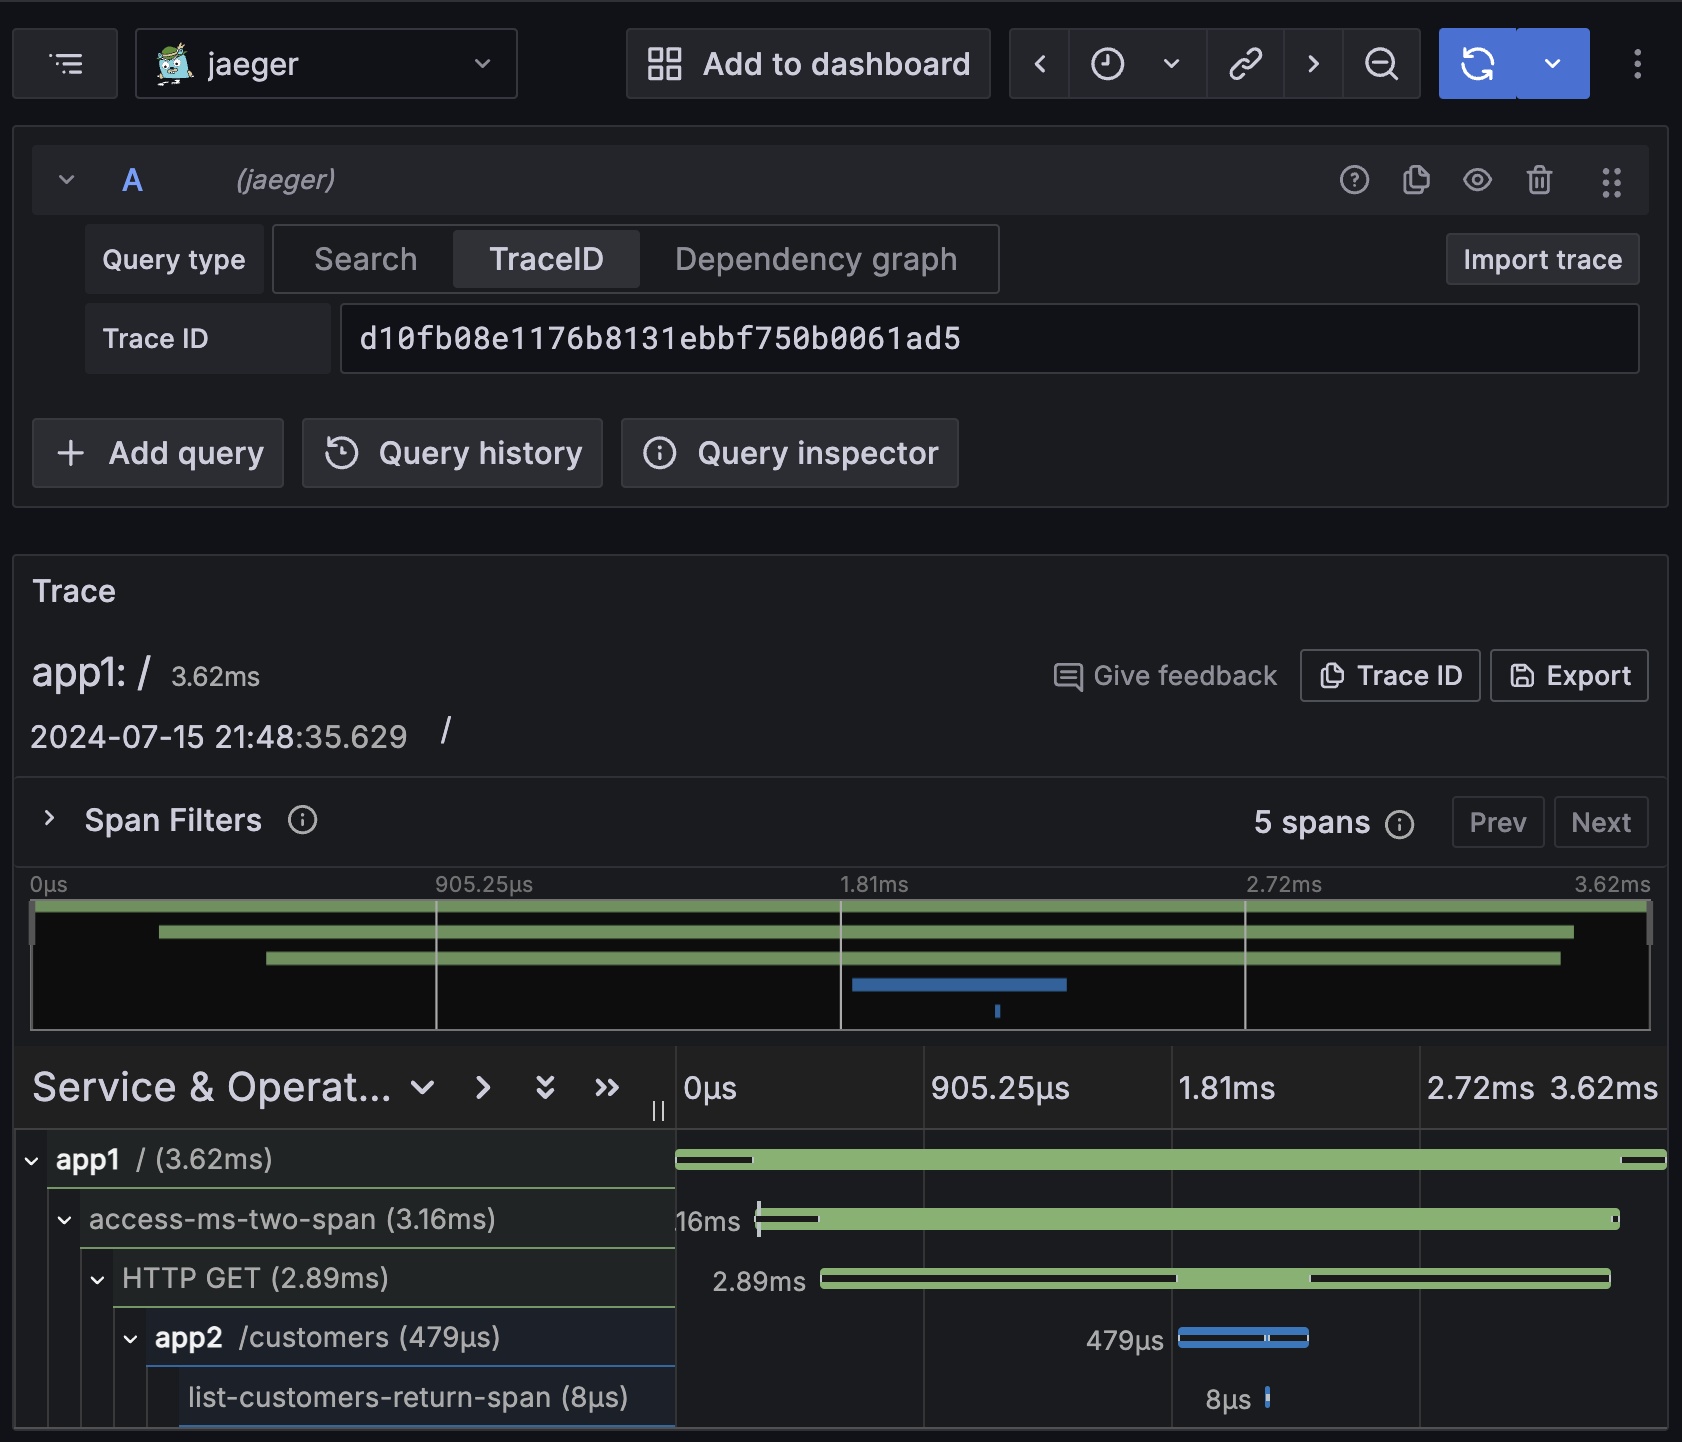
Distributed tracing expands to environments where multiple applications and services collaborate to process a request.
In a distributed system, a single request may traverse several applications and services, each of them contributing a part of the processing.
Distributed tracing aims to provide end-to-end visibility into how requests flow through a distributed system, identifying latency points, bottlenecks, and failures.
Conclusion
Tracing is a powerful tool for understanding how requests are processed in an application and how they relate to other requests.
Tracing is especially useful in distributed systems, where several applications and services collaborate to process a request.
But it is also very useful in systems where a request may be processed by several parts of the application.
4. 🚨 Monitoring: Unveiling Mysteries in Real Time
Monitoring is the act of actively observing the state of a system to detect problems and take corrective action.
Monitoring is an essential part of observability, because it provides real-time information about the state of a system and helps identify that problems are occurring.
We use alerts to notify the system operators when some alerting policy is violated. These alerts help keep the system operators aware of what is happening.
There are two approaches to Monitoring, which we call Active and Passive.
| Aspect | Active Monitoring | Passive Monitoring |
|---|---|---|
| Method | Sends requests/probes to the system | Observes network traffic and collects logs |
| Proactivity | Proactive | Reactive |
| Overhead | Can add extra load to the system | Low overhead |
| Problem Detection | Detects problems quickly through constant probing | May detect problems after they have occurred |
| Advantages | Fast detection, preventive action, detailed metrics | Low overhead, detailed information, historical analysis |
| Disadvantages | Network overhead, possible false positives | Reactivity, dependence on log quality |
The practice of active monitoring is common in critical systems, where problem detection and preventive action are essential to ensure the system's availability and reliability.
Think of it as constantly poking the system to see if it is responsive and working as it should.
Passive monitoring, on the other hand, is a common practice for all systems.
Conclusion
To monitor a system effectively, define metrics and thresholds so that when a threshold is violated, an alert is fired and the system operator receives a notification.
But be careful with the excess of alerts, because that can lead to alert fatigue and cause operators to ignore important alerts.